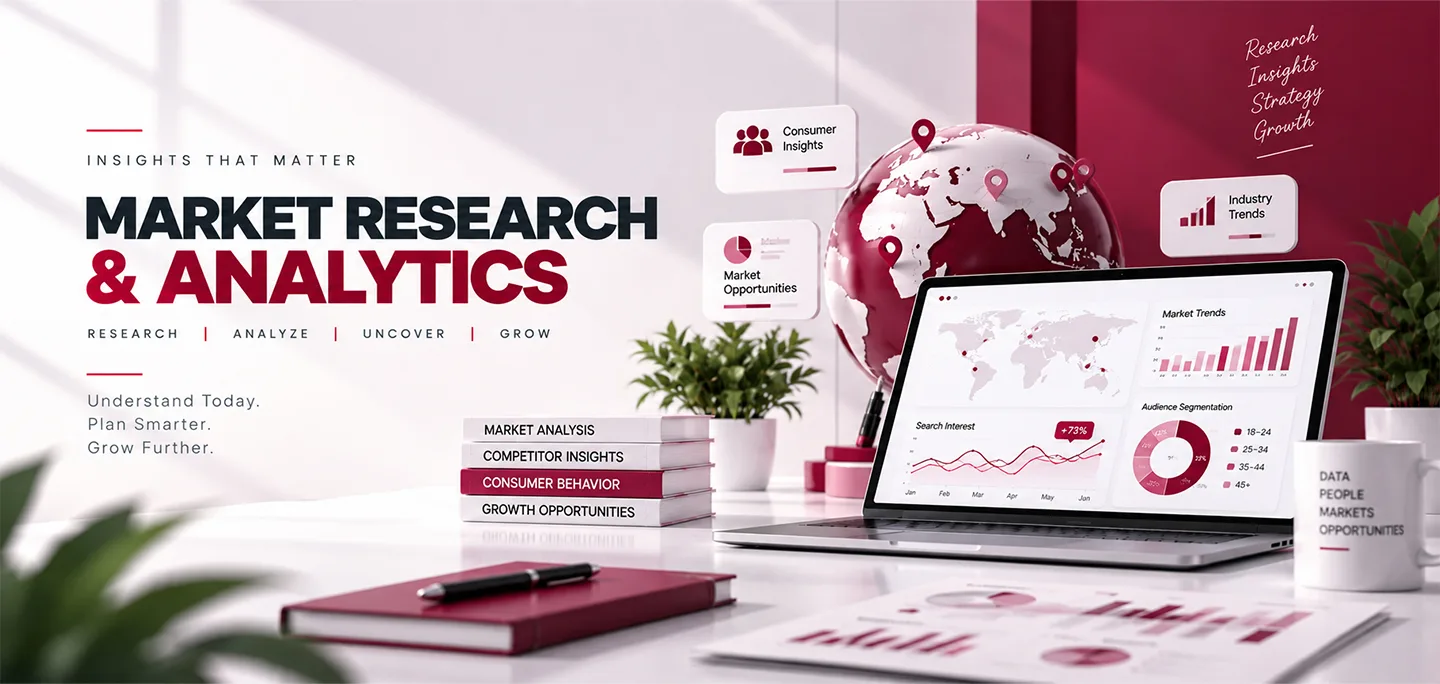
Your business is already producing data: website visits, customer activity, sales numbers, campaign results, social media responses, and financial figures.
Digitiz helps businesses bring their data together, make it easier to understand, and use it to answer real business questions. From Web Analytics and Marketing Analytics to Customer, Sales, Financial, and Business Intelligence, we help turn scattered information into a clearer view of how your business is performing.
A report can tell you that sales went up. An analytics system can show you where your visitors came from. But the more useful questions are: "Why did it happen? What changed? Where is the opportunity? What should you look at next?" That's where analytics becomes valuable. We help you understand:
Where your customers are coming from across digital channels and locations.
What topics, products, services, and features they are genuinely interested in.
How people browse your pages, consume content, and navigate site journeys.
Which specific campaigns and promotional activities are driving actual returns.
Where potential customers lose momentum or exit before completing an action.
What patterns are developing and how metrics are shifting across months and quarters.
Where untargeted demand or emerging buyer segments exist in your market.
Which parts of your business require immediate operational or strategic focus.
From data collection and business intelligence to predictive modeling and visualization, we bring clarity to every aspect of your enterprise.
 Data Pipeline
Useful analysis starts with reliable information. We help bring relevant data from different sources together so you can work with a complete picture instead of checking disconnected reports.
 BI Dashboards
You shouldn't have to search through multiple spreadsheets to find one important number. We create intuitive BI dashboards and reports that bring key metrics into clear view.
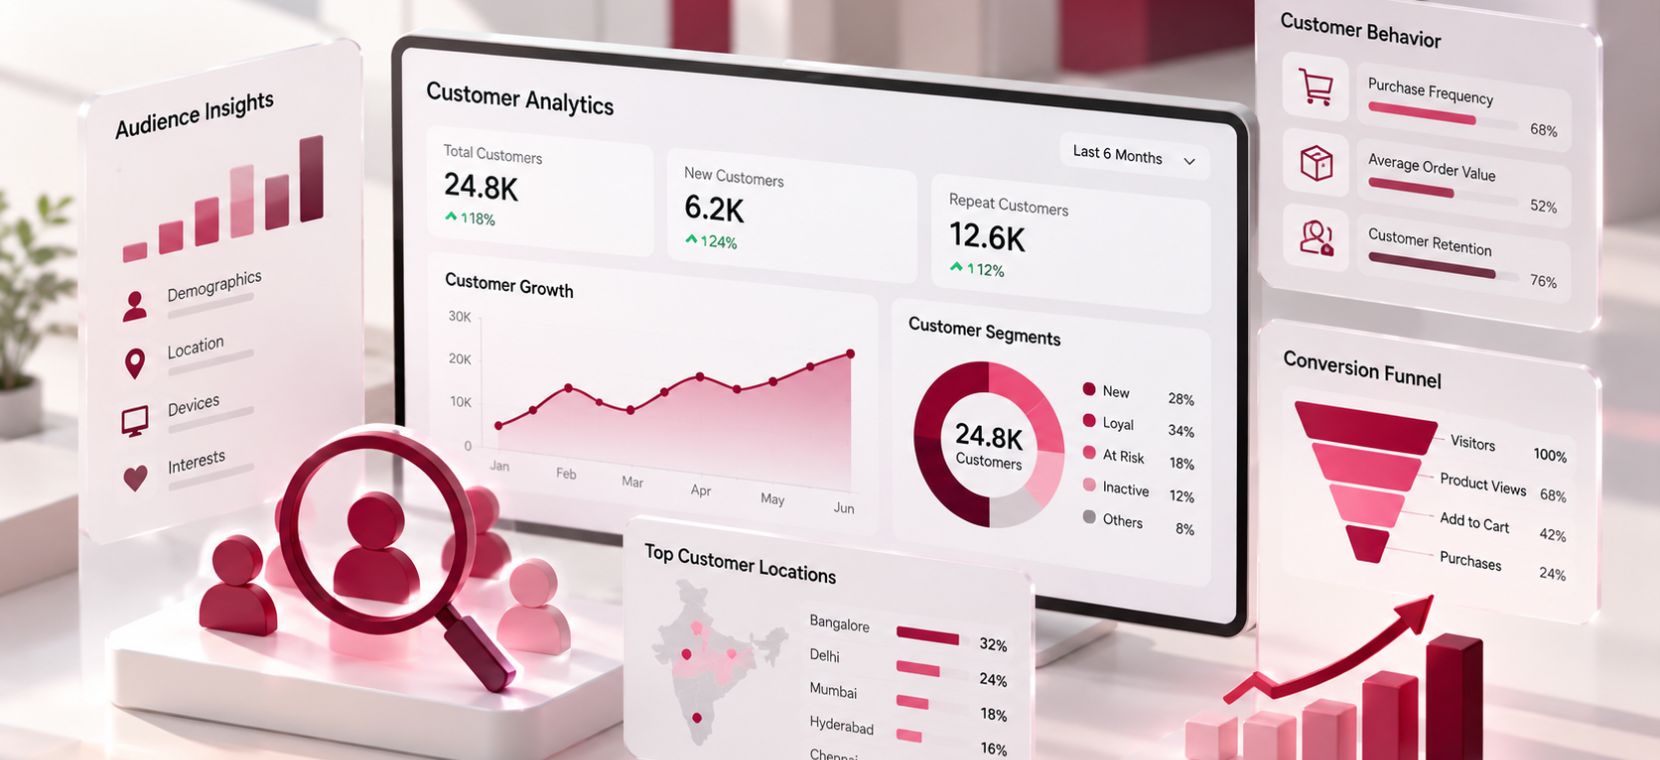 Audience Intelligence
Your customers leave useful signals behind through their interactions. We analyze customer behavior to uncover actionable insights across touchpoints.
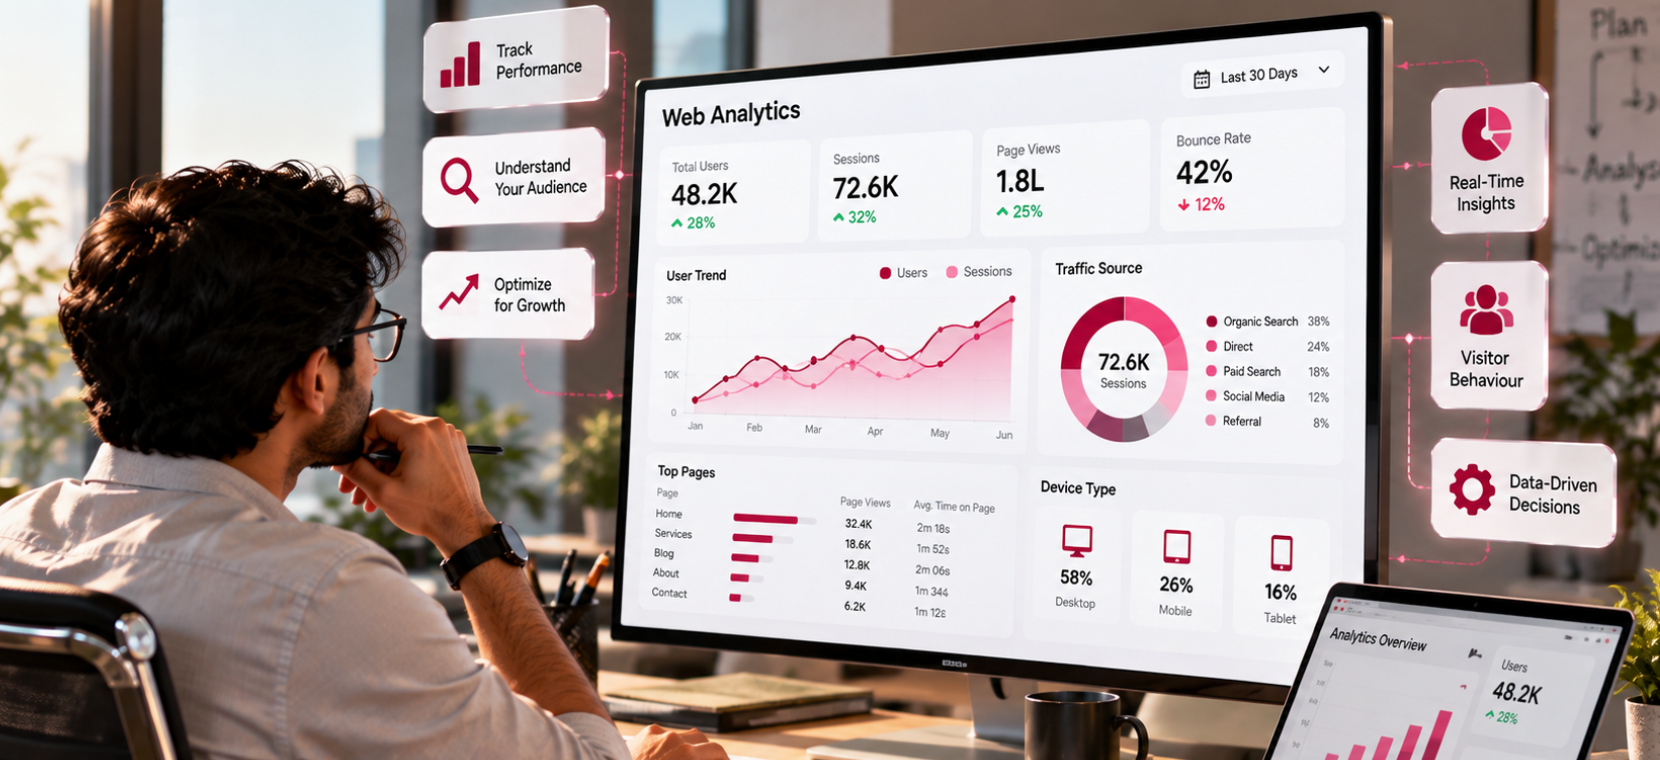 Web Traffic
Your website can tell you far more than how many people visited it. We examine the deeper patterns of user engagement and website efficiency.
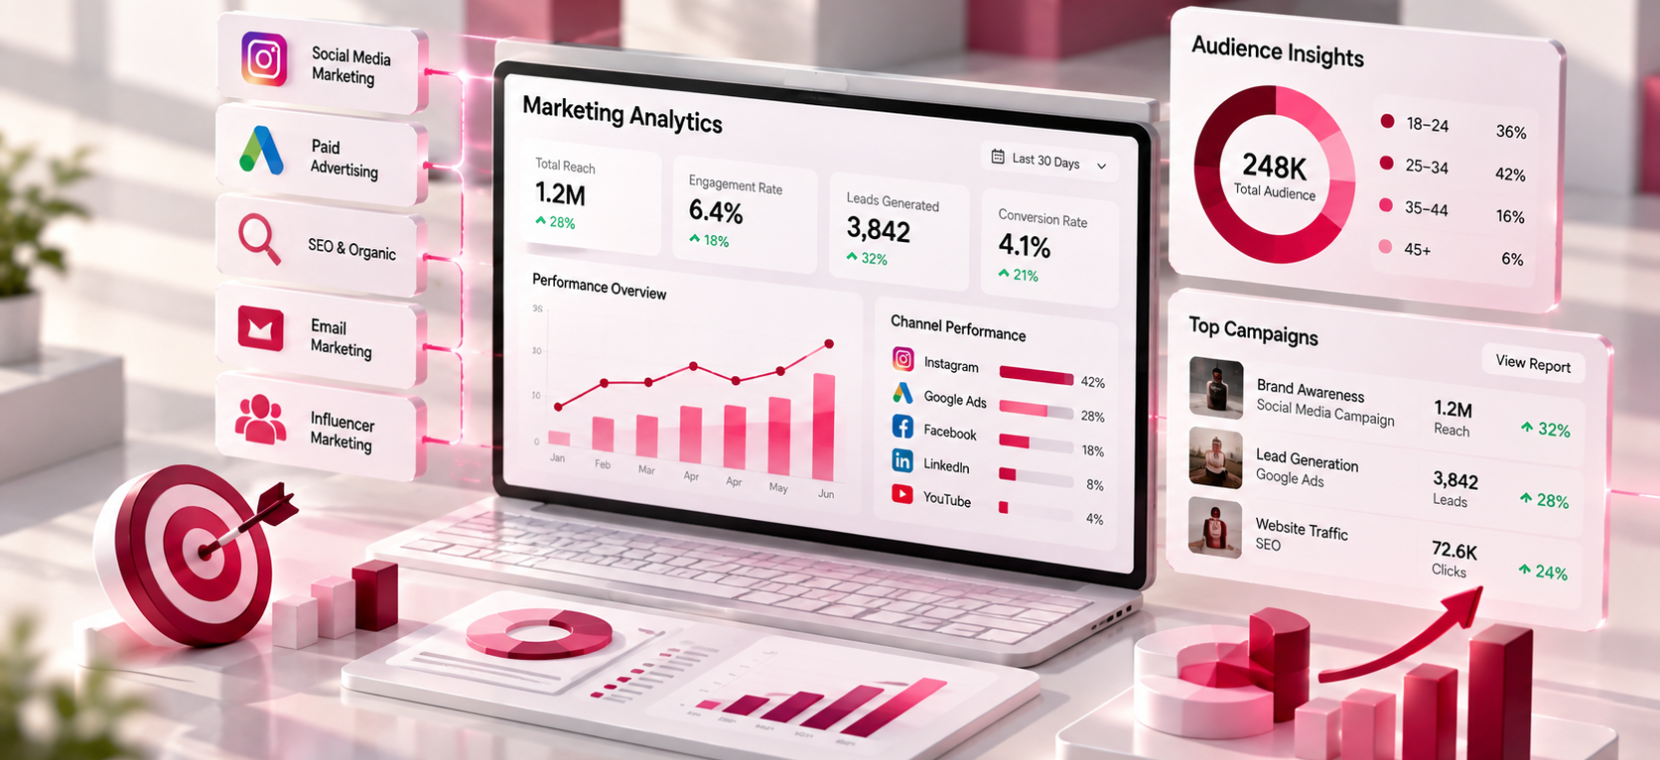 Channel ROI
Marketing involves many moving parts. SEO, paid advertising, social media, and content all contribute to your results. We bring this data together for greater clarity.
 Engagement Metrics
Social platforms generate plenty of numbers. The challenge is knowing which ones are worth paying attention to and how they impact brand reach.
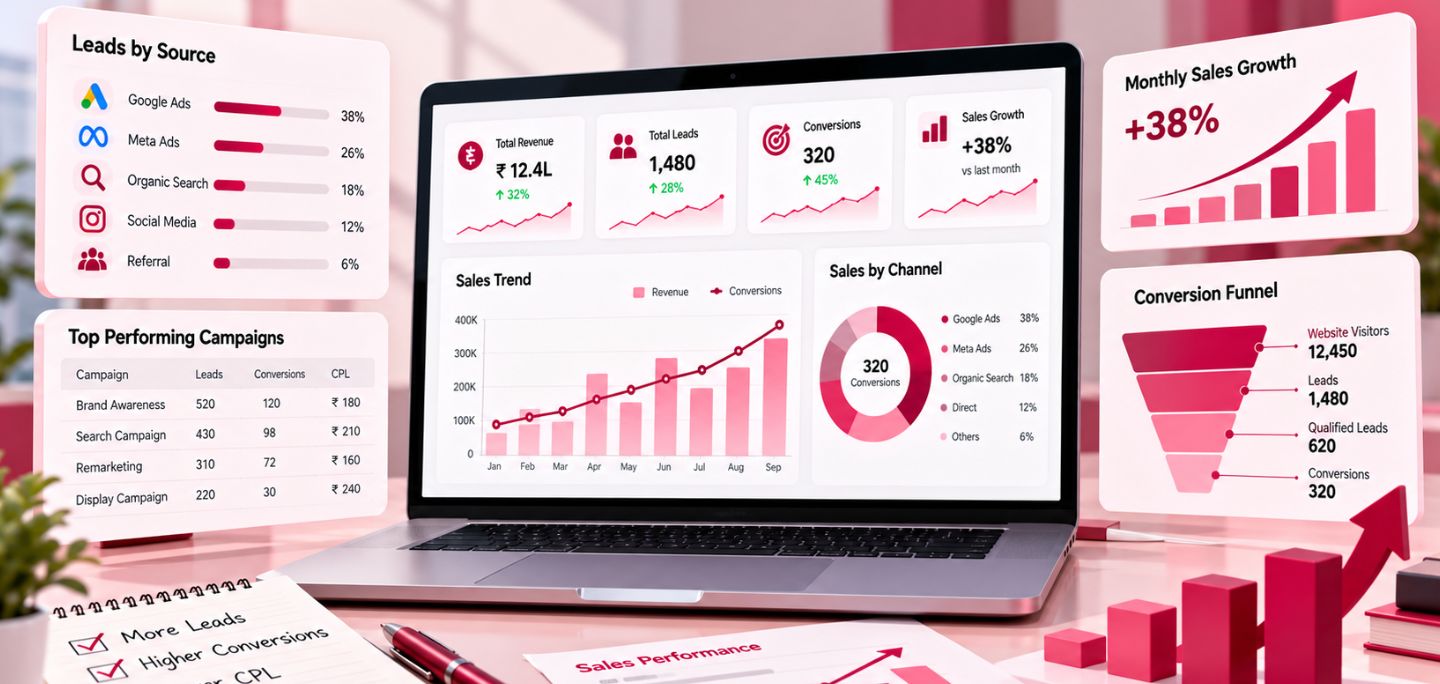 Revenue Streams
Sales data can reveal patterns that are easy to miss when looking at individual deals. We uncover trends across products, pipelines, and segments.
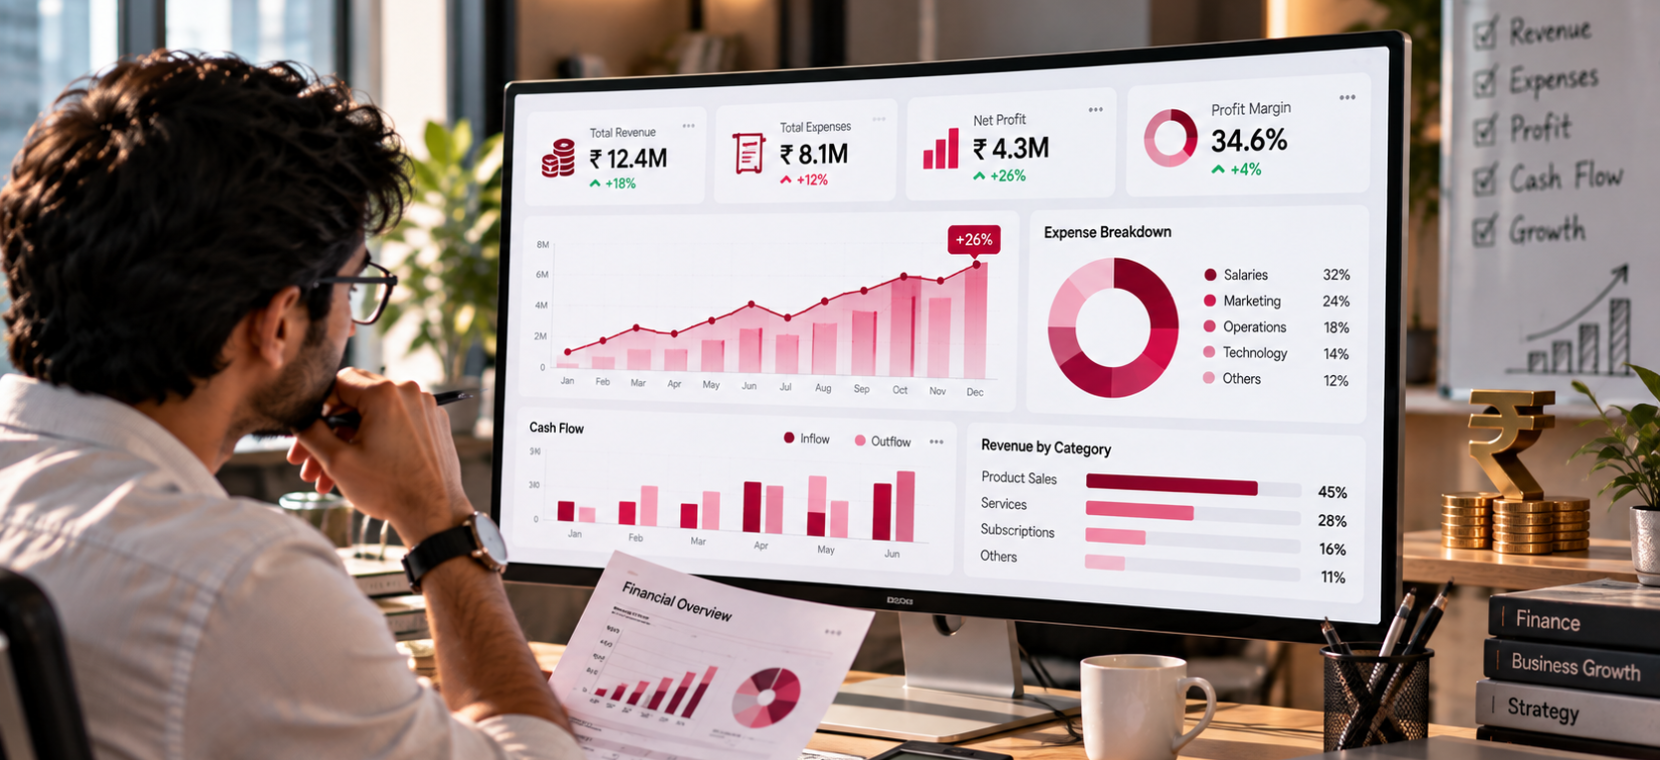 Fiscal Health
Financial information becomes more useful when you can see the operational patterns behind it. We structure metrics for strategic executive review.
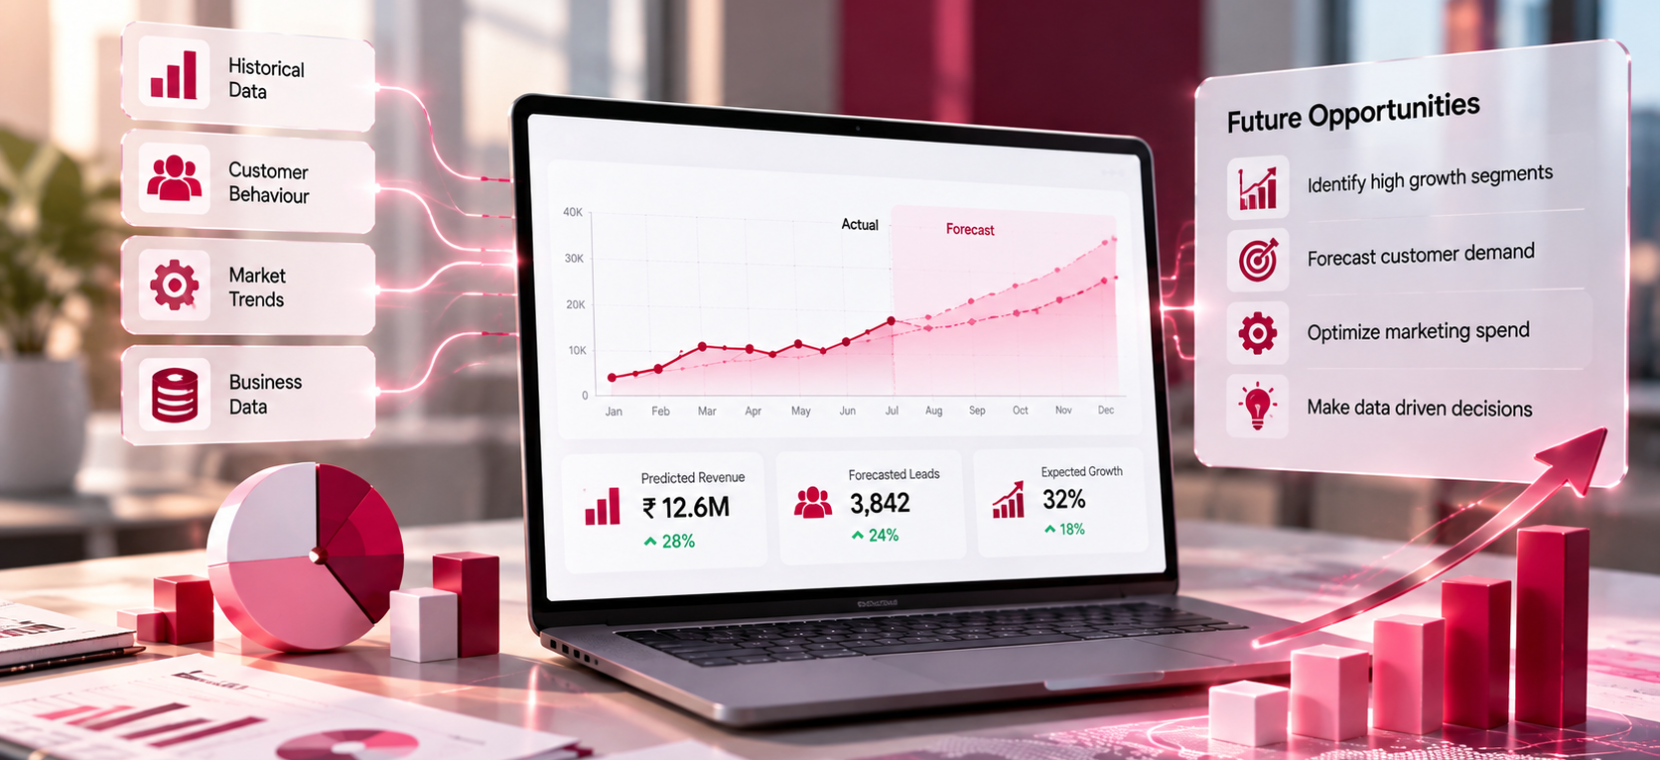 Forecasting
Historical data can help you prepare for what may come next. We apply statistical analysis and predictive methods to identify possible future patterns.
 Visual Insights
Not everyone needs to work with raw tables and spreadsheets. We turn complex data into clear, intuitive visual formats that everyone can understand.
Different businesses have different questions. Instead of starting with a rigid, fixed list of reports, we look at what your data reveals across primary business dimensions:
A disciplined, transparent process that translates data complexity into actionable business momentum.
We begin with the business itself: what you are trying to achieve, what decisions you are making, what data exists, and what is difficult to understand.
We determine which sources, metrics, and parameters are relevant to answering your core commercial questions.
Where required, information from disparate sources is collected and organized so different pieces can be analyzed in unified context.
We look for shifts, correlations, unexpected movements, performance gaps, and emerging trends that deserve management attention.
Complex figures are structured into clean dashboards, visualizations, and summary reports tailored to your team's workflow.
We identify what the findings mean for your operational priorities and where tactical changes will deliver the highest impact.
Business conditions change and so does your data. We continue evaluating performance to verify that decisions produce the intended results over time.
Analytics should not end when the report is delivered.
The useful part begins when you know what to do with it.We look beyond isolated charts to connect data intelligence directly with your broader business roadmap.
A dashboard shows what happened; we understand why that information matters to your business. The same number can mean completely different things depending on your market, model, and goals.
Digitiz works across IT Services, Software, Web Development, and Digital Marketing. That provides a cohesive perspective on how marketing campaigns, site experience, customer behavior, and sales all interact.
More reports do not equal better decisions. We focus exclusively on intelligence that answers a specific question, clarifies a problem, spots an opportunity, or drives action.
You shouldn't need a degree in data science to understand your own company metrics. We present findings in clear, conversational language that leadership teams can immediately apply.
Whether you require targeted web analytics, end-to-end marketing attribution, sales intelligence, or multi-system executive dashboards, we scope every solution to your exact operational scope.
Clear answers to common questions about marketing analytics, custom dashboards, web tracking, and predictive insights.
You may already have more information than you realize. The next step is making sense of it. Whether you need Web Analytics, Marketing Analytics, Customer Analytics, Business Intelligence, Sales Analytics, Financial Analytics, or Data Visualization, Digitiz can help you bring the right information together and understand what it is telling you.
Tell us about your data sources, platforms, and reporting goals. We will help you unlock actionable clarity.